The researchers address this topic using two empirical data with well-resolved phylogenies sets, such as yeast and plants. This researchers introduced varying amounts of missing data into varying numbers of genes and test whether the benefits of excluding genes with missing data outweigh the costs of excluding the non-missing data that are associated with them. The researchers also test if there is a proportion of missing data in the incomplete genes at which they cease to be beneficial or harmful, and whether missing data consistently bias branch length estimates.
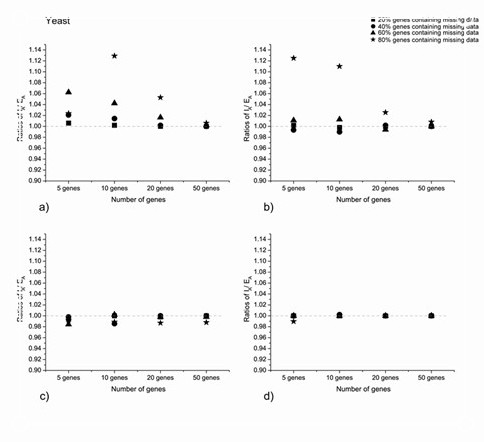
This results indicate that adding incomplete genes generally increases the accuracy of phylogenetic analyses relative to excluding them, especially when there is a high proportion of incomplete genes in the overall dataset (and thus few complete genes). Detailed analyses suggest that adding incomplete genes is especially helpful for resolving poorly supported nodes. Given that the researchers find that excluding genes with missing data often decreases accuracy relative to including these genes (and that decreases are generally of greater magnitude than increases), there is little basis for assuming that excluding these genes is necessarily the safer or more conservative approach. The researchers also find no evidence that missing data consistently bias branch length estimates.
This study findings have been published recently on Molecular Phylogenetics and Evolution. The paper is now available online at http://authors.elsevier.com/sd/article/S1055790314002735
This work was supported by National Key Basic Research Program of China (Grant No. 2014CB954100), Key Research Program of the Chinese Academy of Sciences (Grant No. KJZD-EW-L07), the National Natural Science Foundation of China (Grant No. 40830209).

Impacts of including versus excluding incomplete genes on phylogenetic accuracy for concatenated maximum likelihood analysis of multi-locus data for 8 species of yeast. Accuracy is based on all nodes. Ratios >1 indicate that including incomplete genes (IA) increases accuracy relative to excluding these genes (EA). Results are shown separately for (a) ~25%, (b) ~50%, (c) ~75%, and (d) 87.5% missing data in the incomplete genes in data matrices of four different sizes (total of 5, 10, 20, and 50 genes, when all genes are included). The four symbols indicate results when 20%, 40%, 60%, and 80% of the genes contain missing data


