The length of time a flower remained open (i.e., from anthesis to flower senescence) is called as floral longevity. Floral longevity has been considered one of the most important reproductive traits as it determines opportunities for pollen dispersal and capture of pollen by stigmas as well as has the potential to influence within-plant pollinator foraging and opportunities for geitonogamous self-pollination.
Floral longevity exhibits substantial variation, spanning from several hours to tens of days, and such variation even occurs among species within same family, same genus, or same species at different sites. Since Kerner von Marilaun first observed this issue at 1895, floral longevity has attracted much attention from evolutionary biologists. However, there is still remarkably little information about large-scale geographical patterns in floral longevity and it’s corelates.
Research team from Kunming Institute of Botany, Chinese Academy of Sciences (KIB/CAS) using published floral longevity data from 818 angiosperm species in 134 families and 472 locations worldwide, the latitudinal patterns of floral longevity and the relationships between floral longevity and a range of biotic and abiotic factors have been quantified.
The results showed that in all angiosperms investigated, floral longevity averaged at 4.5 days, ranging from 2 hours (Heteracia szovitsii, Asteraceae) to 33 days (Telipogon peruvianus, Orchidaceae), with a 400-fold variation.
Floral longevity exhibited a significant phylogenetic signal, indicating that related species tended to have similar durations of anthesis. There was a strong latitudinal gradient in floral longevity and such latitudinal trend still existed after accounting for elevation. Mean floral longevity increased from c. 2 days at the equator to c. 4.9 days at 50° N and c. 3.9 days at 50° S.
In contrast to traditional view, flowers of self-incompatible species, herbaceous species, invertebrate-pollinated species and species with large flowers did not have longer life-span than those of self-compatible species, woody species, vertebrate-pollinated species and species with small flowers. For male and female fitness components, floral longevity was positively correlated with pollen number per flower and negatively correlated with pollination success index.
In regions in which plants experience environmental conditions including high temperature, high solar radiation and low water availability, floral longevity was significantly shorter. However, when all biotic and abiotic variables were considered simultaneously, only mean temperature of flowering season and pollen number per flower had significant effect on floral longevity.
These results suggest that physiological processes associated with floral maintenance play a key role in explaining latitudinal variation in floral longevity across global ecosystems, with potential implications for floral longevity under global climate change and species distributions.
These results were published online in the Journal New Phytologist entitled as “Global analysis of floral longevity reveals latitudinal gradients and biotic and abiotic correlates”.
This work was supported by the Second Tibetan Plateau Scientific Expedition and Research (STEP) program, the Strategic Priority Research Program of Chinese Academy of Sciences, National Natural Science Foundation of China, the National Key Research and Development Program of China, the Young Academic and Technical Leader Raising Foundation of Yunnan Province, and the Ten-thousand Talents Program of Yunnan Province.
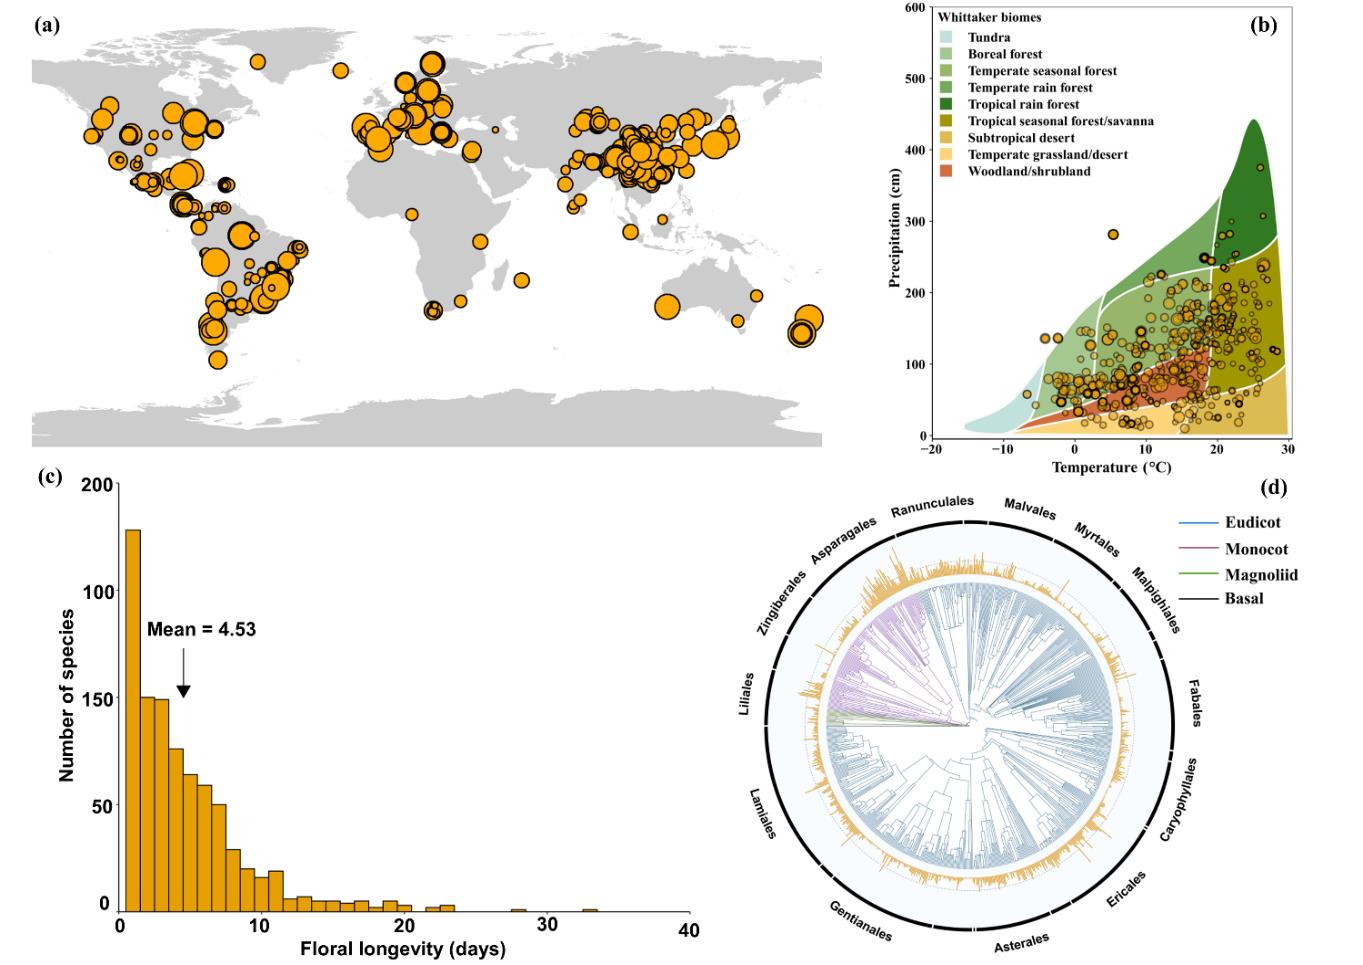
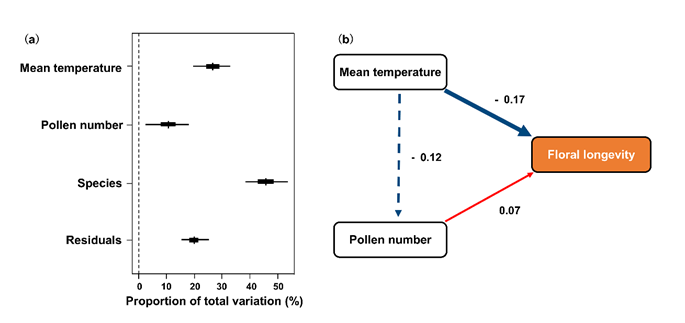
Fig. 2 (a) The contribution of temperature, pollen number and the phylogenetic relationships of species on the variation of flower longevity. Residuals are the error rate that is not explained by the model. Vertical lines are estimated posterior means, short thick lines are the 50% posterior credible intervals, and the long thin lines are the 95% posterior credible intervals. (b) Structural equation model linking the mean temperature during flowering months and pollen number per flower with floral longevity. Values near arrows represent standardized coefficients. Red and blue arrows represent positive and negative effects, respectively, and solid and dashed arrows represent significant and non-significant effects. (Image by KIB)
(Editor: YANG Mei)